Combining Posit’s open source tools and Azure for a cloudy MLOps deployment
Author
James H Wade
Published
January 22, 2023
If you’re like me, the decisions about deployment locations and “the cloud” are out of your control at work. Whether you use AWS, GCP, Azure, or another, you are stuck with the cloud you’ve been given. The purpose of this article is to demonstrate a model deployment using Posit’s open source tools for MLOps and using Azure as the deployment infrastructure. This is the second article in a series on MLOps. See the first one that uses Posit Connect for deployment.
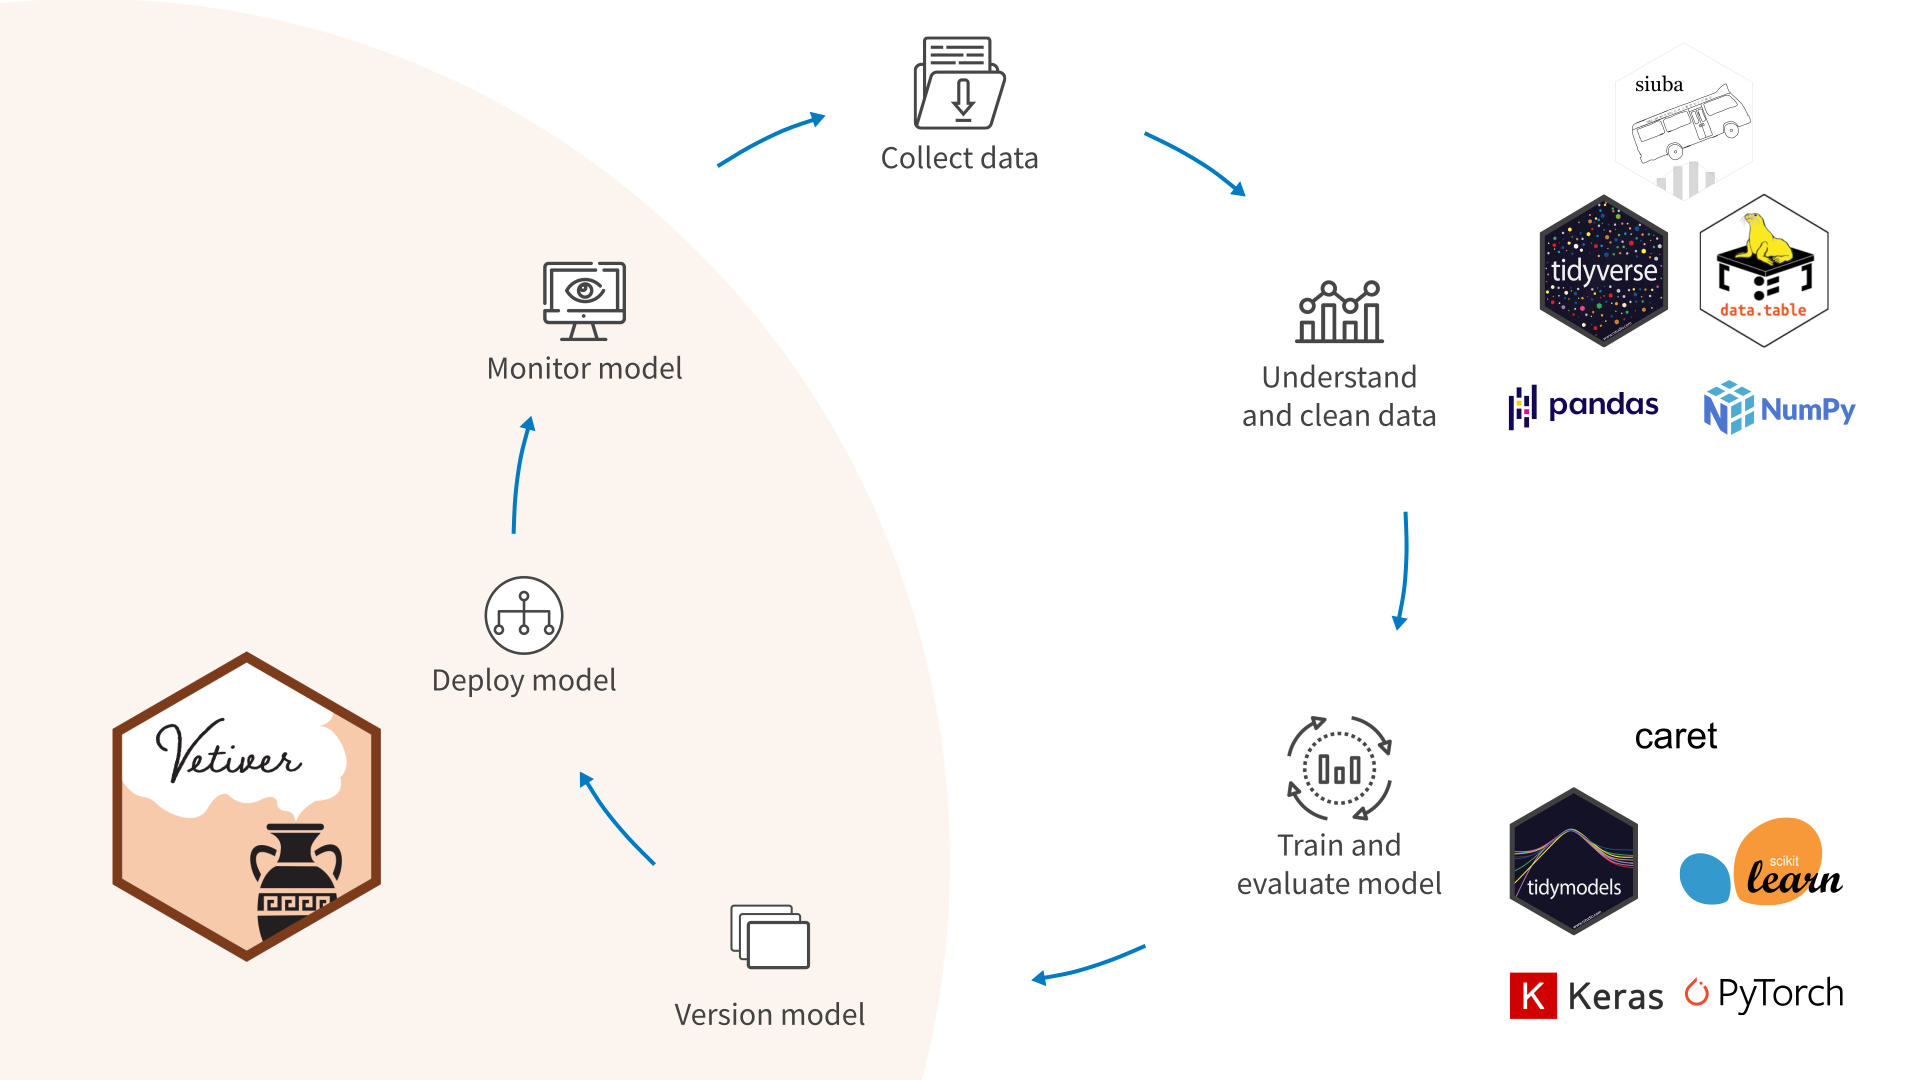
Source: MLOps Team at Posit | An overview of MLOps with Vetiver and friends
Model Building
We covered model builidng in part one, but here is the code from there to save time searching around for it.
The {vetiver} package is provides a set of tools for building, deploying, and managing machine learning models in production. It allows users to easily create, version, and deploy machine learning models to various hosting platforms, such as Posit Connect or a cloud hosting service like Azure. Part one showed a Connect deployment, and this one will use an Azure storage container as the board.
The vetiver_model() function is used to create an object that stores a machine learning model and its associated metadata, such as the model’s name, type, and parameters. vetiver_pin_write() and vetiver_pin_read() functions are used to write and read vetiver_model objects to and from a server.
Create an Pins Board in an Azure Storage Container
To access an Azure storage container, we can use the {AzureStor} packages. If you are using Azure, you are most likely using it in a corporate environment. That often comes with company-specific policies. If these are new to you, your best bet is to find someone who is already familiar with the cloud environment at your organization. This example uses SAS (Shared Access Signature) key authentication, which is a way to grant limited access to Azure storage resources, such as containers, to users or applications. SAS keys are generated by Azure Storage and provide a secure way to access storage resources without sharing the account key or the access keys associated with the storage account.
To use SAS keys for accessing Azure storage containers, you will need to create a SAS key and use it to authenticate your requests to the storage API. You can learn more about SAS keys and how to generate them from Microsoft Learn.
Below is an example for how to access an Azure storage container, create or connect to a board, and list pins stored in side it if any exist. The code assumes that the user has already set the AZURE_CONTAINER_ENDPOINT and AZURE_SAS_KEY environment variables and has installed the AzureStor and pins packages in their R environment.
The storage_container() function from the AzureStor package is used to create a storage container object, which represents a container in an Azure storage account. The endpoint parameter specifies the endpoint URL for the storage container, and the sas variable specifies a SAS key that is used to authenticate requests to the container.
The Sys.getenv() function is used to retrieve the values of the AZURE_CONTAINER_ENDPOINT and AZURE_SAS_KEY environment variables. This assumes you already set AZURE_CONTAINER_ENDPOINT and AZURE_SAS_KEY in something like a .Renviron file. These variables should contain the endpoint URL and SAS key for the Azure storage container, respectively.
The board_azure() function from the {pins} package creates a pins board object that in the Azure storage container.
Create Vetiver Model
To deploy our model with {vetiver}, we starting with our final_fit_to_deploy from above, we first need to extract the trained workflow.
We can do that with tune::extract_workflow(). The trained workflow is what we will deploy as a vetiver_model. That means we need to convert it from a workflow to a vetiver model with vetiver_model().
── penguins_model ─ <bundled_workflow> model for deployment
A glm classification modeling workflow using 5 features
Pin Model to Board
Once the model_board connection is made it’s as easy as vetiver_pin_write() to “pin” our model to the model board and vetiver_pin_read() to access it.
model_board |>vetiver_pin_write(v)
Creating new version '20230122T144640Z-a875f'
Writing to pin 'penguins_model'

Create a Model Card for your published model
• Model Cards provide a framework for transparent, responsible reporting
• Use the vetiver `.Rmd` template as a place to start
model_board |>vetiver_pin_read("penguins_model")
── penguins_model ─ <bundled_workflow> model for deployment
A glm classification modeling workflow using 5 features
Create Model API
Our next step is to use {vetiver} and {plumber} packages to create an API for our vetiver model, which can then be accessed and used to make predictions or perform other tasks via an HTTP request. pr() creates a new plumber router, and vetiver_api(v) adds a POST endpoint to make endpoints from a trained vetiver model. vetiver_write_plumber() creates a plumber.R file that specifies the model version of the model we pinned to our model dashboard with vetiver_pin_write().
library(plumber)pr() |>vetiver_api(v)
# Plumber router with 2 endpoints, 4 filters, and 1 sub-router.
# Use `pr_run()` on this object to start the API.
├──[queryString]
├──[body]
├──[cookieParser]
├──[sharedSecret]
├──/logo
│  │ # Plumber static router serving from directory: /Library/Frameworks/R.framework/Versions/4.2/Resources/library/vetiver
├──/ping (GET)
└──/predict (POST)
Here is an example of the azure_plumber.R file generated by vetiver_write_pumber().
# Generated by the vetiver package; edit with carelibrary(pins)library(plumber)library(rapidoc)library(vetiver)# Packages needed to generate model predictionsif (FALSE) {library(parsnip)library(recipes)library(stats)library(workflows)}b <-board_azure(AzureStor::storage_container("https://penguinstore.blob.core.windows.net/penguincontainer"), path ="")v <-vetiver_pin_read(b, "penguins_model", version ="20221222T172651Z-50d8c")#* @plumberfunction(pr) { pr %>%vetiver_api(v)}
Deploying Elsewhere with Docker
If Posit Connect is not the right place for our model, vetiver_write_docker creates a dockerfile and renv.lock. Deployment is much more complicated when not using Posit Connect. If this is your first time creating a deployment, I recommend you connect with me or someone else with experience in Azure deployments.
Here is an example of the dockerfile that is generated.
# Generated by the vetiver package; edit with careFROM rocker/r-ver:4.2.2ENV RENV_CONFIG_REPOS_OVERRIDE packagemanager.rstudio.com/cran/latestRUNapt-get update -qq&&apt-get install -y--no-install-recommends\ libcurl4-openssl-dev \ libicu-dev \ libsodium-dev \ libssl-dev \ make \ zlib1g-dev \&&apt-get cleanCOPY azure/vetiver_renv.lock renv.lockRUNRscript-e"install.packages('renv')"RUNRscript-e"renv::restore()"COPY plumber.R /opt/ml/plumber.REXPOSE 8000ENTRYPOINT ["R", "-e", "pr <- plumber::plumb('/opt/ml/plumber.R'); pr$run(host = '0.0.0.0', port = 8000)"]
To deploy our API in Azure using that Dockerfile, we need to:
Build a Docker image of your API using the Dockerfile. We need to have [docker installed](https://docs.docker.com/get-docker/) on the system we use to build the container. You can build the docker image from the Dockerfile by running the following command in the directory where your Dockerfile is located:
Terminal
docker build -t penguin-image .
Push the Docker image to a container registry. A container registry is a service that stores Docker images and makes them available for deployment. Azure’s registry is called Azure Container Registry (ACR). Before we can push the image to ACR, we need to log in to the ACR using the az acr login command from the Azure CLI. We also need to create an ACR instance in Azure if we don’t already have one. To push the Docker image to a container registry, you will need to use the Azure CLIdocker push command and specify the image name and the registry URL. For example, to push the image to ACR, you can use the following command:
Terminal
az acr login --name vetiverdeploydocker tag penguin-image:latest vetiverdeploy.azurecr.io/penguin-imagedocker push vetiverdeploy.azurecr.io/penguin-image
Here, vetiverdeploy is the name of our ACR and penguin-image is the name of our Docker image. The latest tag indicates that this is the latest version of the image. For more information on how to push a Docker image to ACR, you can refer to the official Microsoft documentation: Push and pull Docker images with Azure Container Registry Tasks. To break down these commands a bit further:
az acr login --name vetiverdeploy logs in to the Azure Container Registry with the specified name (in this case, vetiverdeploy). This is necessary in order to push images to the registry.
docker tag penguin-image:latest vetiverdeploy.azurecr.io/penguin-image tags the Docker image with the specified image name and registry URL. The image name is penguin-image, and the registry URL is vetiverdeploy.azurecr.io/penguin-image. The latest tag indicates that this is the latest version of the image.
docker push vetiverdeploy.azurecr.io/penguin-image pushes the Docker image to the specified registry URL. In this case, the image will be pushed to the vetiverdeploy ACR.
We now need to create an Azure Container Instance (ACI) that uses our docker image we created and registered above. This can be done either using the Azure CLI or in the Azure Portal.
With the ACI build complete, we have successfully deployed our API!
WarningAzure can be frustrating at first
These instructions are unlikely to be good enough to deploy a model without some familiarity with Azure. Please comment on this post or find someone with Azure experience for help.
Using the API to Make Predictions
The API deployment site url is http://penguin.eastus.azurecontainer.io, and the prediction endpoint is http://penguin.eastus.azurecontainer.io:8000/predict.
You can also use {httr} to call the API. In most cases, it is easier for R users to use predict rather than httr::POST. However, were this model written in another language, making predictions using {httr} would likely bet the best approach.
library(httr)url <-"http://penguin.eastus.azurecontainer.io:8000/predict"json_data <- jsonlite::toJSON(new_data)response <-POST(url, body = json_data)response
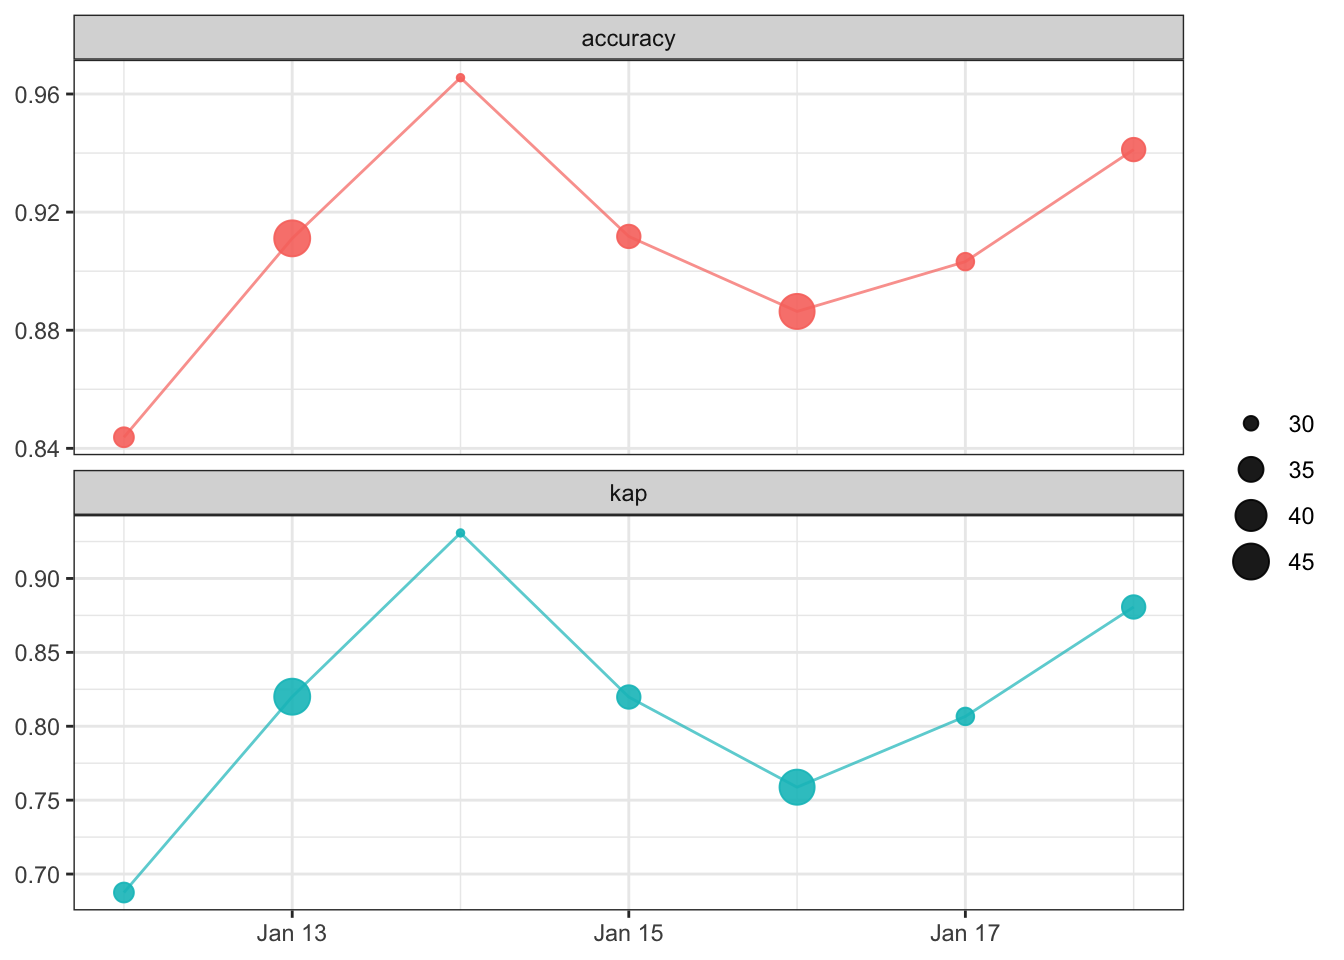
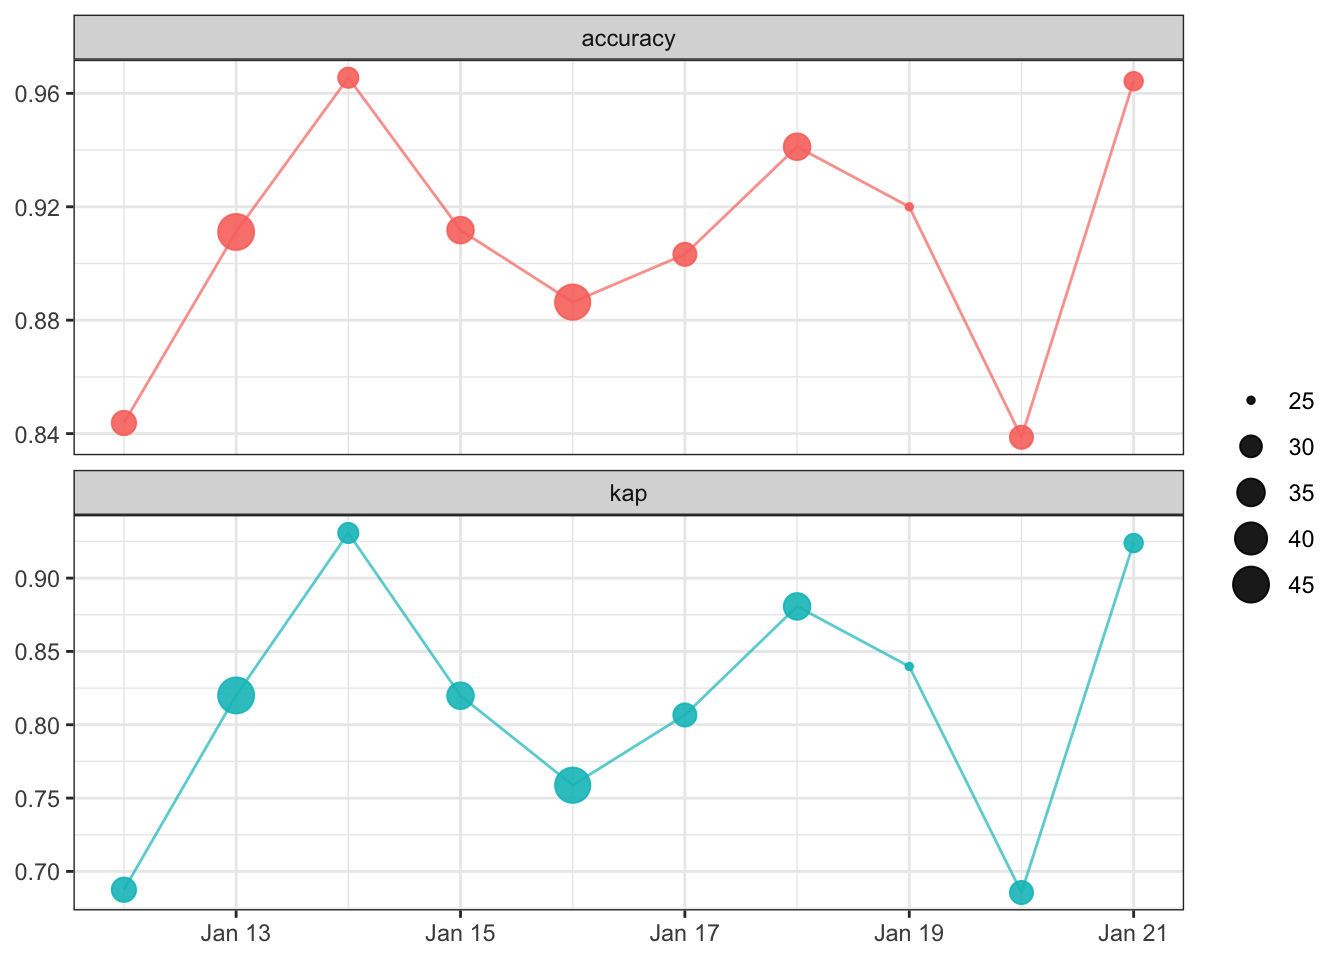
Machine learning can break quietly; a model can continue returning predictions without error, even if it is performing poorly. Often these quiet performance problems are discussed as types of model drift; data drift can occur when the statistical distribution of an input feature changes, or concept drift occurs when there is change in the relationship between the input features and the outcome.
Without monitoring for degradation, this silent failure can continue undiagnosed. The vetiver framework offers functions to fluently compute, store, and plot model metrics. These functions are particularly suited to monitoring your model using multiple performance metrics over time. Effective model monitoring is not “one size fits all”, but instead depends on choosing appropriate metrics and time aggregation for a given application.
As a baseline for model performance, we can start by using our training set to create original metrics for the model. We also simulate a date_obs column. In a real example, you should use the date the data was collected.